Historical Data
MLAP predicts fuel moisture at a reference time from the history of atmospheric conditions preceding it. Two parameters define that history:
- \(t_{max\_history}\) (
max_history_to_consider) — how far back to look - \(t_{history}\) (
history_interval) — how often to sample within that window
Both drive feature count directly, so both trade accuracy against cost.
Effect of maximum history
Five datasets were extracted with \(t_{history}\) fixed at 4 h and \(t_{max\_history}\) varied from 32 to 48 hours. Each has 3,000 reference times and 4,000 grid points — about 12 million rows.
| Dataset | \(t_{max\_history}\) | History times | Features | R² (test p95) | R² (test) |
|---|---|---|---|---|---|
| 46 | 32 h | 8 | 41 | 0.8937 | 0.8257 |
| 63 | 36 h | 9 | 46 | 0.8981 | 0.8317 |
| 64 | 40 h | 10 | 51 | 0.9000 | 0.8331 |
| 65 | 44 h | 11 | 56 | 0.9010 | 0.8354 |
| 66 | 48 h | 12 | 61 | 0.9028 | 0.8383 |
Accuracy increases monotonically with history length — but barely. Going from 32 to 48 hours raises R² from 0.8937 to 0.9028, about one percentage point for a 50% increase in the number of history times and a rise from 41 to 61 features.
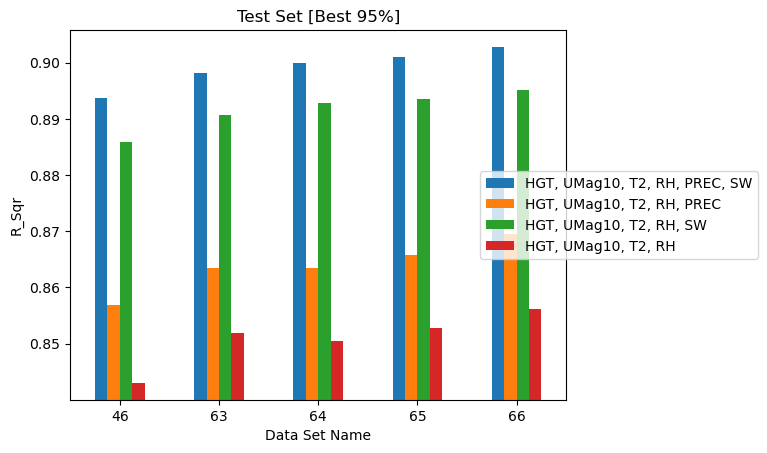
Correlation between ground truth and predicted FM for datasets varying in maximum history.
The physics is sensible — more history covers more of the drying and wetting cycle a fuel element has experienced — but the returns do not justify the cost for 10-hour fuels. \(t_{max\_history} = 32\) h is the recommended baseline.
Larger fuel categories equilibrate more slowly, so 100-hour and 1000-hour fuels would be expected to need longer windows. That has not been tested.
Effect of history interval
Four datasets were extracted with \(t_{max\_history}\) fixed at 32 h and \(t_{history}\) varied. These use 1,000 reference times and 1,000 grid points — 1 million rows, an order of magnitude smaller than the datasets above, yet landing in a similar accuracy range.
| Dataset | \(t_{history}\) | History times | Features | R² (test p95) | R² (test) |
|---|---|---|---|---|---|
| 96 | 8 h | 4 | 21 | 0.8471 | 0.7633 |
| 79 | 4 h | 8 | 41 | 0.8724 | 0.7978 |
| 94 | 2 h | 16 | 81 | 0.8815 | 0.8088 |
| 95 | 1 h | 32 | 161 | 0.8837 | 0.8112 |
The response is asymmetric around the 4-hour baseline:
- Refining from 4 h to 1 h gains about 1 percentage point (0.8724 → 0.8837) for four times the history times and four times the features — a poor trade.
- Coarsening from 4 h to 8 h costs about 2.5 percentage points (0.8724 → 0.8471) — a sharp drop.
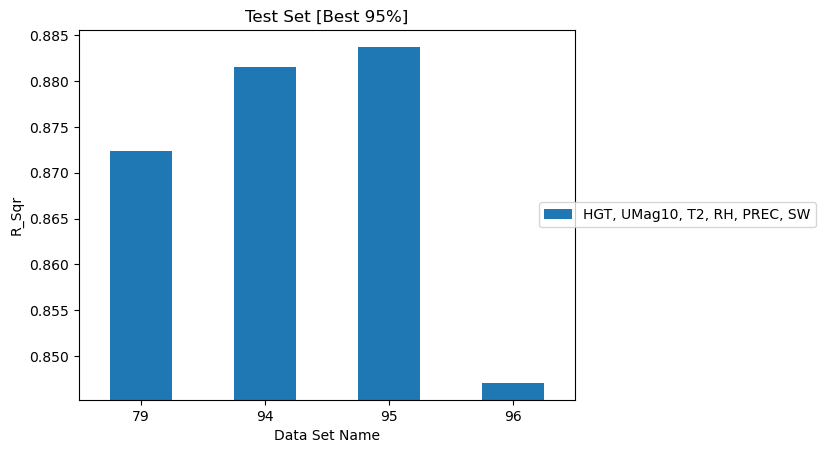
Correlation between ground truth and predicted FM for datasets varying in history interval.
At \(t_{history} = 8\) h only four historical times remain, which is evidently too coarse to resolve the diurnal cycle that drives 10-hour fuel moisture. The 4-hour interval sits just on the right side of that cliff.
\(t_{history} = 4\) h is the recommended baseline — finer sampling costs a great deal for very little, and coarser sampling degrades quickly.
Combined guidance
The baseline used throughout the rest of this assessment is \(t_{max\_history} = 32\) h with \(t_{history} = 4\) h, giving 8 historical times and 41 features with five quantities of interest plus elevation.
| If you want | Change |
|---|---|
| Highest accuracy, cost no object | \(t_{max\_history} = 48\) h, \(t_{history} = 1\) h |
| Balanced default | \(t_{max\_history} = 32\) h, \(t_{history} = 4\) h |
| Cheapest defensible | \(t_{max\_history} = 32\) h, \(t_{history} = 4\) h — do not coarsen to 8 h |
Note that the two parameters were varied independently, never jointly, so any interaction between them is unmeasured.